 |
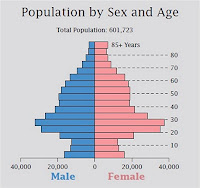
| Hey look the Census made a profile graphic for just the occasion! |
One of the most interesting demographic features of Washington is the age distribution of its residents. Nationally, 24% of American residents are below the age of 18 years; but in the District of Columbia this rate drops to 16%. That means there aren't a lot of kids or teenagers around. Nonetheless the median age of Washington is 34 years, the lowest of any US state.
"So... DC is full of mid-thirty year olds," you might suppose. Cool, a young city! In reality though, the city is even "younger" than that. Who likes population pyramids?!
In fact, more than 22% of the total population of DC is between 20-29 years old. That's crazy! Those long blue and pink arms on the graph are not typical, even in progressive tech- or media-centric cities like San Francisco, Los Angeles, Portland or Boston. This age group is most concentrated (and growing most rapidly) in Wards 1, 2 and 6 - that's basically Dupont, Adams Morgan, Columbia Heights, Capitol Hill and China Town-ish. Women slightly outnumber men overall in the District at about 47-53%.
Perhaps fitting with the age distribution is the unusual ratio of homeowners to renters. As of the 2010 Census, 58% of all households in the District of Columbia were rental units. Renter-occupied units outnumber owner-occupied units in every Ward (especially W1, W2 and W8) except for Wards 3 and 4. For reference, that is a lot. When more than 1/2 of the total resident population is living in rental housing - and presumably many or most of them are transient within 3-5 years (still looking for data) - we begin to get an idea of practical representation in the city.
As a general rule, people renting a living space don't care as much about medium- and long-term development plans as do people that have invested in owning property. A renter's frame of reference makes him/her very responsive to short-term disruptions or inconveniences imposed by construction or rezoning issues, whereas a person that owns a property may ultimately be interested in higher potential land-values and investing in local social relationships, infrastructure, etc. over a longer period. (longer term => higher returns). Of course, this macro-effect presumes that the tenants are either active in pressing their interests in public planning, or that others anticipate particular responses and change their own behavior (i.e. they don't propose digging up a main street for redevelopment because they expect tenants to wig out regardless), or some variation of the two.
The gross state product for Washington in 2010 topped $103 billion. But that's nothing when you compare it to the gross product of the greater Washington Metropolitan Area that totals more than $425 billion and over 5.5 million residents, making it the fourth largest metropolitan economy in the United States.
"Whaaaahhh?!" you might ask, "We don't even have skyscrapers!!" No we don't, but we do have high-rollers.
Despite this outrageous figure for a place with short buildings, Washington is a city with stark divisions. A report published in 2007 found that about one-third of District residents were functionally illiterate, compared to a national rate of about one in five. Washington's high rate of foreign immigration is partly responsible, though many attribute the low literacy to chronic under-performance of the District's public school system (which has been ranked the most expensive and lowest performing system among the other 50 states). Additionally, 18.4% of DC residents were below the federal poverty line as of 2009, lower only than Arkansas at 18.8%. In contrast to high levels of illiteracy, 50% of DC residents have at least a 4-year college degree and the personal per capita money income among Washingtonians of $42,000 - among the highest in the US.
The Black population in Washington has steadily decreased since its peak in 1970 at an average annual rate of 11.5% between 2000 and 2010. Gentrification of traditionally Black neighborhoods has quickened in the past decade in areas like Capitol Hll, Columbia Heights, Logan Circle and Petworth as the non-Hispanic White population has increased at an average annual rate of 31.4% in the past decade. It's understandable why perceptions of racial and economic tensions persist even today, though the City has apparently taken some recent steps to mediate income disparities in poorer communities over the past few years (that is, before the crash... more on that another time).
That's the District by the numbers, in a nutshell. Stay tuned for our next episode on...
LOCAL GOVERNANCE ! !


No comments:
Post a Comment